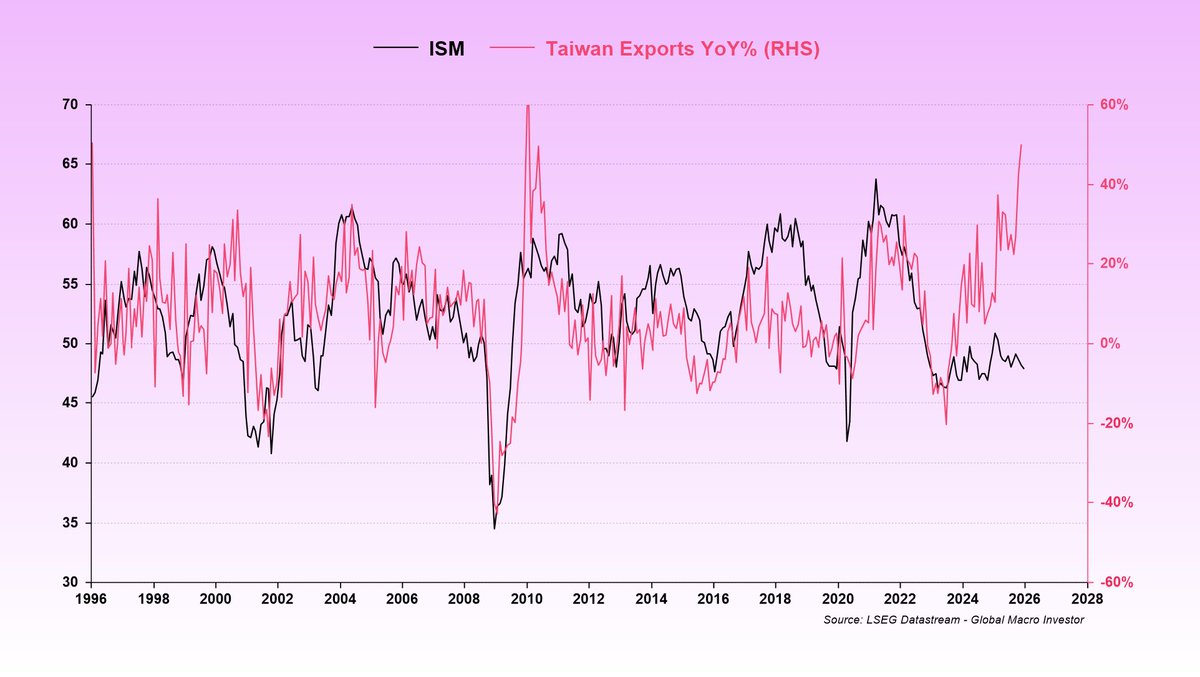
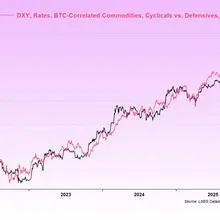
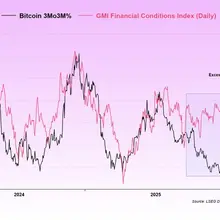
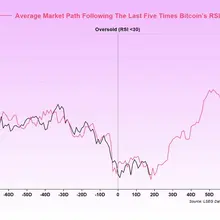
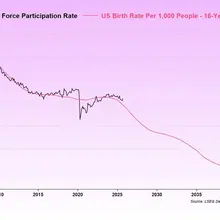
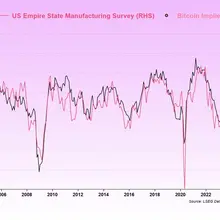
This chart probably best encapsulates the story of 2025. It’s a chart I shared in several of my reports last year, and it also explains why ISM remained lower than we initially expected. This shows the relationship between Taiwan exports and ISM. At its core, it’s the story