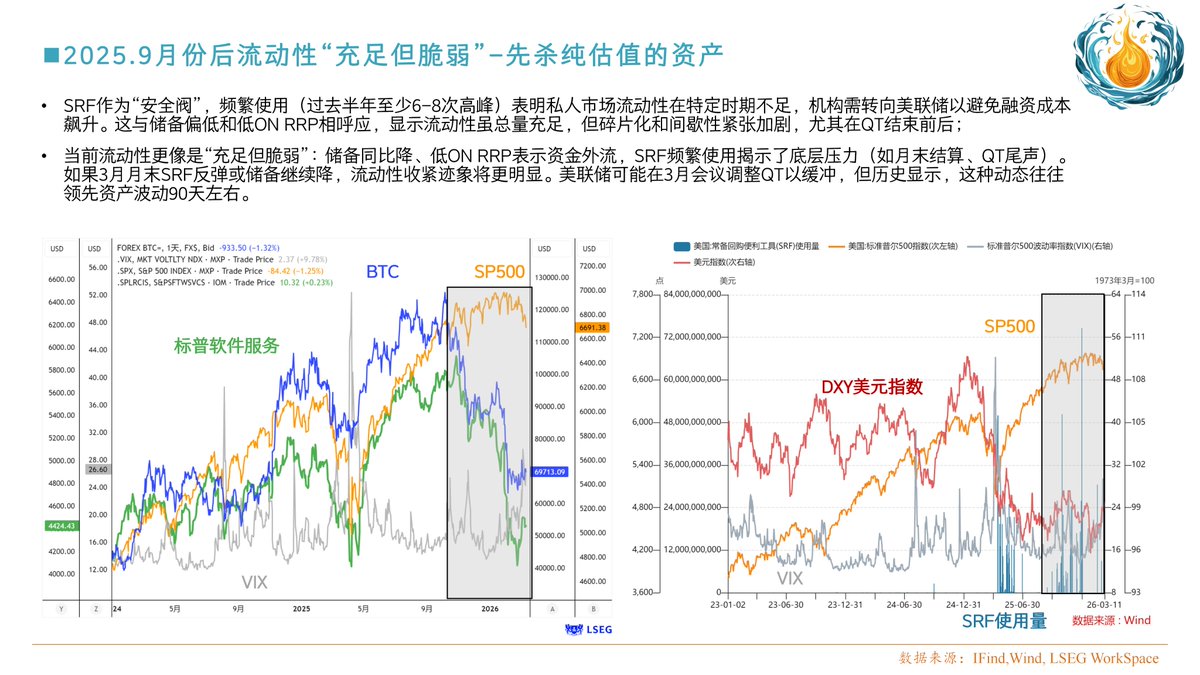
【2026.5.15】 In the chart, the blue line represents the ratio of the CBOE S&P 500 Risk Reversal Index (RXM SM Index) to the S&P 500 Index, the brown line represents the Cape Ratio, and the gray line represents the VIX. The RXM SM index is an SPX long strategy packaged with