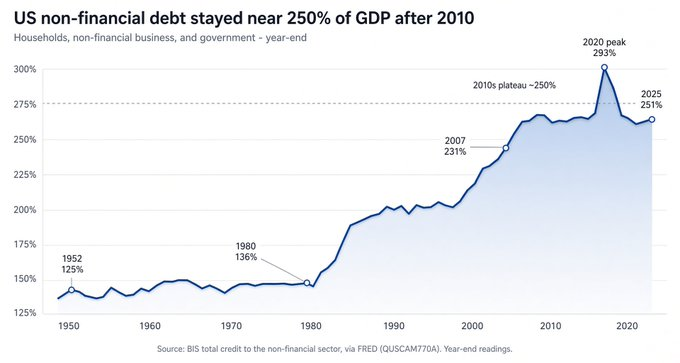
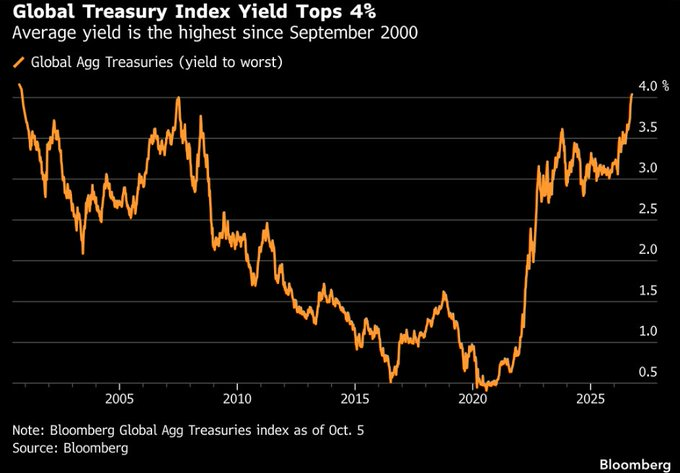
This chart puts total US nonfinancial debt near 250% of GDP, roughly its 2010s level. But it combines households, businesses and government. A stable total can hide shifts between them—and doesn’t settle the debate over Treasury yields.Graham Hayes @Bbw_Tankette · 2026-10-03