Graham Hayes

@Bbw_Tankette

Day job. Brokerage account. Earnings calls on the drive home. Writing down my investment ideas so I can’t pretend I knew it all along.

已收录 14 条帖子

  1. #1

    Nasdaq futures reversed sharply from the low in this chart, built a base, then pushed higher before stalling near the top. The pause midway through the rally stands out: buyers he…

    Nasdaq futures reversed sharply from the low in this chart, built a base, then…
  2. #2

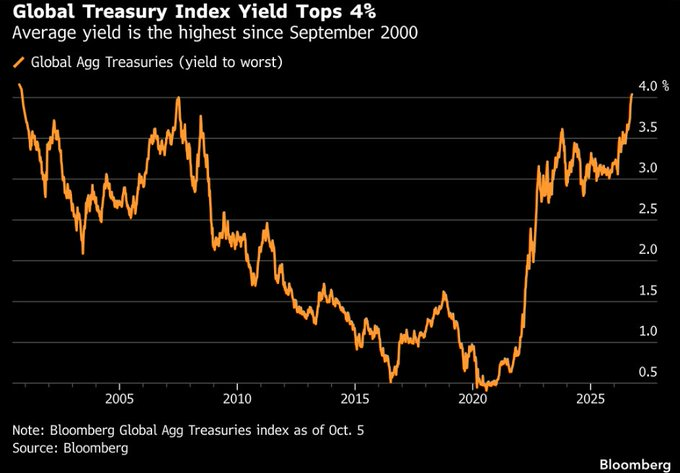
    Global government bond yields top 4% in this Bloomberg snapshot, the highest since September 2000. A very different backdrop from the near-zero era. New buyers get more income, wh…

    Global government bond yields top 4% in this Bloomberg snapshot, the highest si…
  3. #3

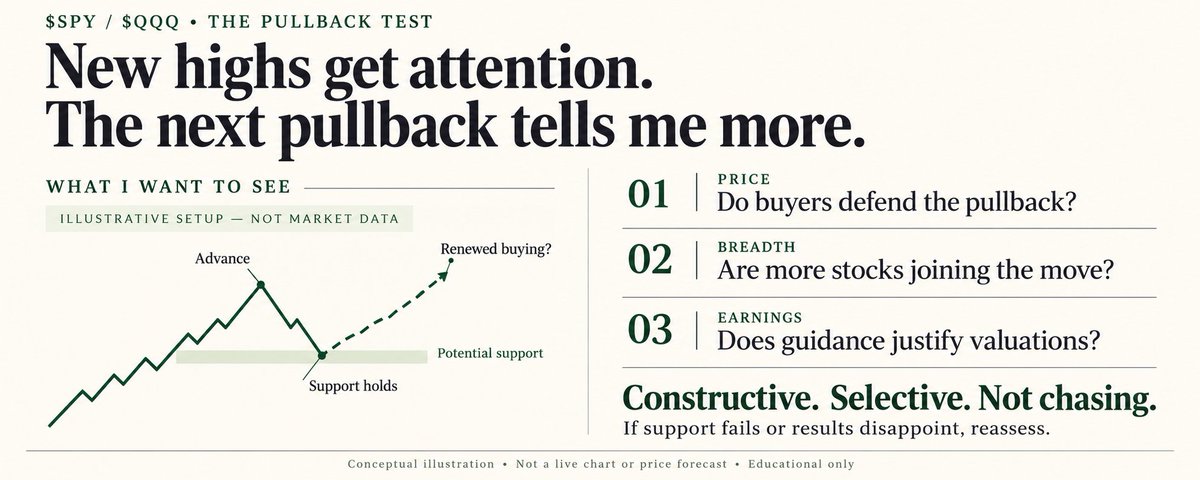
    Still leaning bullish on $SPY and $QQQ. I’d rather see buyers step in on a pullback than chase the next green candle. Holding the gains into the close would give me more confidenc…

    Still leaning bullish on $SPY and $QQQ. I’d rather see buyers step in on a pull…
  4. #4

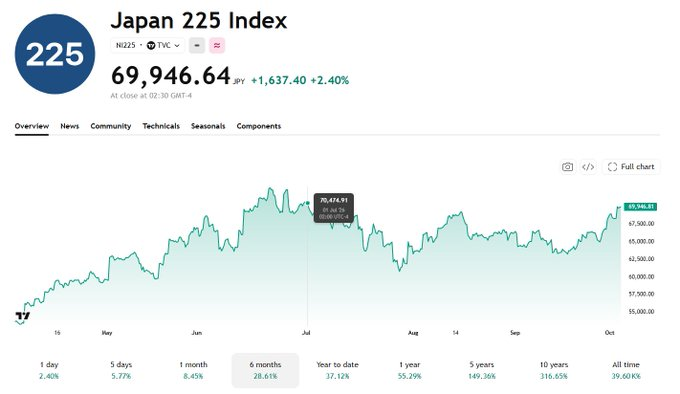
    Japan’s Nikkei is back near 70,000 in this snapshot, up 2.4% on the day and approaching its summer highs. After months of choppy trading, momentum is picking up again. Clearing th…

    Japan’s Nikkei is back near 70,000 in this snapshot, up 2.4% on the day and app…
  5. #5

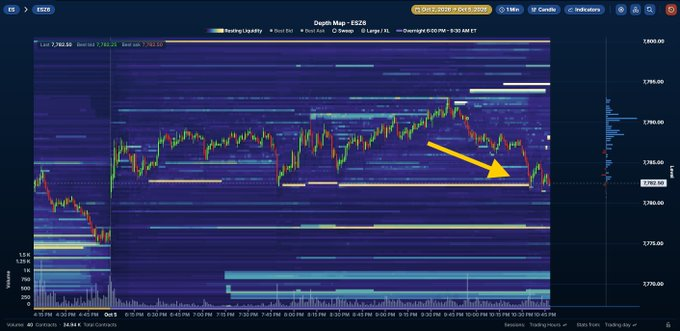
    $ES has a clear decision point around 7,782 in this liquidity map, where price just bounced. If buyers keep defending it, support could hold. A clean break below would put the ope…

    $ES has a clear decision point around 7,782 in this liquidity map, where price…
  6. #6

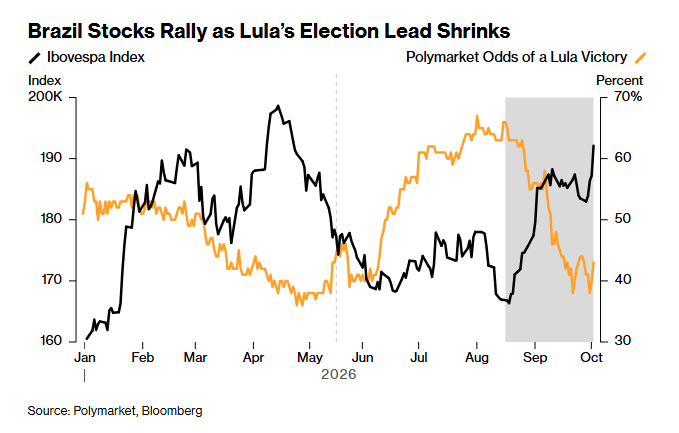
    The first move after the vote should be interesting. Whether it survives the first budget headlines is the bigger test.

    The first move after the vote should be interesting. Whether it survives the fi…
  7. #7

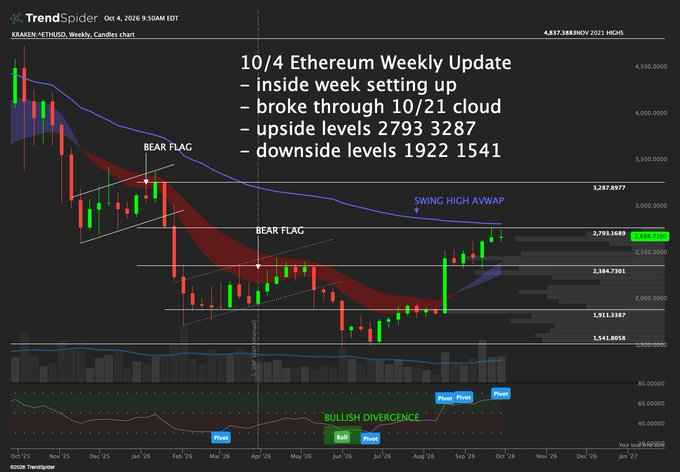
    $ETH is holding above its weekly 10/21 EMA cloud, with an inside week taking shape in this chart. A push through $2,793 would put $3,287 in focus. If the cloud gives way, $2,384 i…

    $ETH is holding above its weekly 10/21 EMA cloud, with an inside week taking sh…
  8. #8

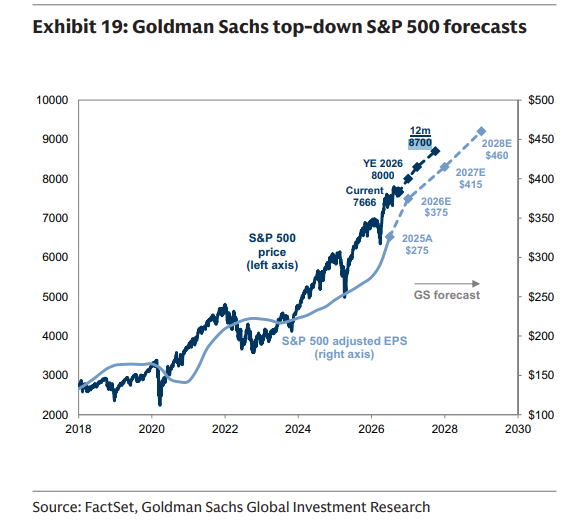
    Goldman’s forecast shown here puts the S&P 500 at 8,700 in 12 months—about 13.5% above the chart’s 7,666 starting point. The earnings path is doing a lot of work: $375 EPS in…

    Goldman’s forecast shown here puts the S&P 500 at 8,700 in 12 months—about…
  9. #9

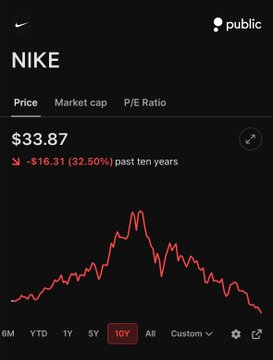
    Ten years, two very different outcomes: this snapshot shows $NVDA up roughly 13,050% and $NKE down 32.5% on price alone. A familiar brand doesn’t guarantee a good investment. The…

    Ten years, two very different outcomes: this snapshot shows $NVDA up roughly 13…Ten years, two very different outcomes: this snapshot shows $NVDA up roughly 13…
  10. #10

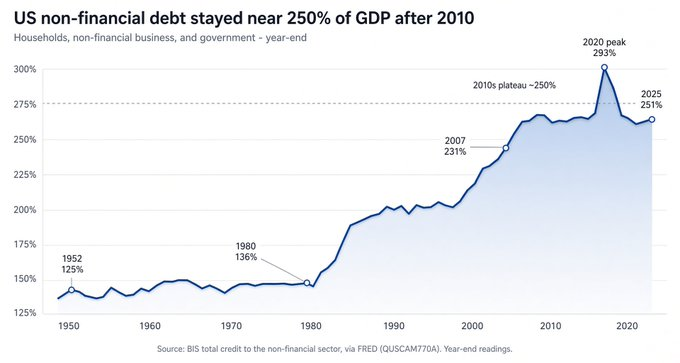
    This chart puts total US nonfinancial debt near 250% of GDP, roughly its 2010s level. But it combines households, businesses and government. A stable total can hide shifts between…

    This chart puts total US nonfinancial debt near 250% of GDP, roughly its 2010s…
  11. #11

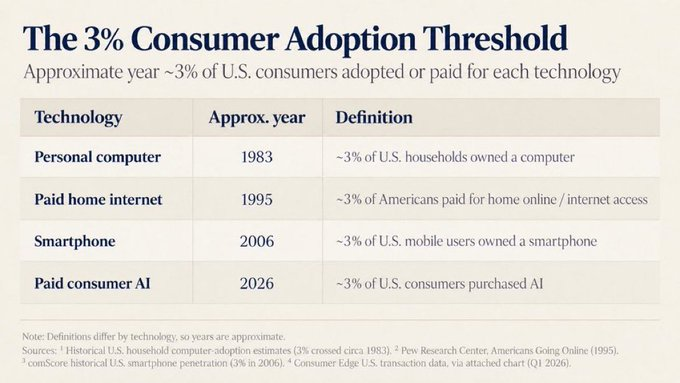
    This chart puts paid consumer AI near 3% adoption, alongside the early days of PCs, home internet and smartphones. Interesting comparison, but adoption isn’t a stock-market clock.…

    This chart puts paid consumer AI near 3% adoption, alongside the early days of…
  12. #12

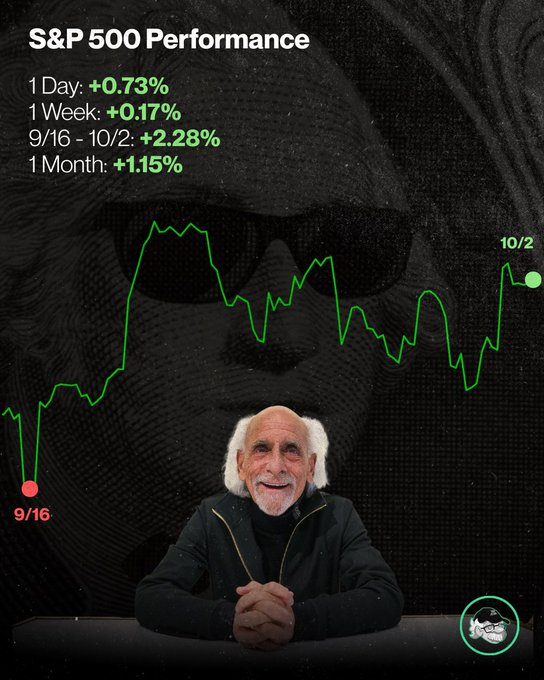
    A strong day inside a quieter week. This S&P 500 snapshot shows +0.73% for the day, but just +0.17% for the week. Since Sept. 16, it’s up 2.28%. Next comes earnings season—and…

    A strong day inside a quieter week. This S&P 500 snapshot shows +0.73% for…
  13. #13

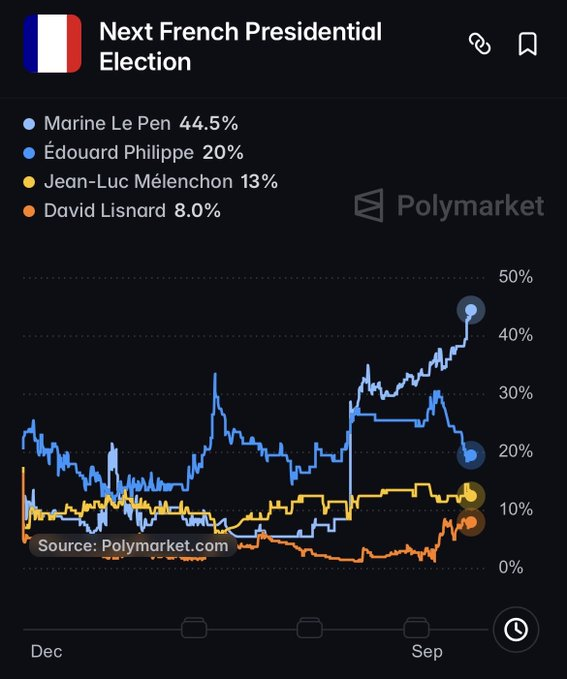
    Marine Le Pen leads this Polymarket snapshot at 44.5%, versus 20% for Édouard Philippe. That’s a sizable gap in market pricing, but it isn’t a polling lead or a guaranteed win. Th…

    Marine Le Pen leads this Polymarket snapshot at 44.5%, versus 20% for Édouard P…
  14. #14

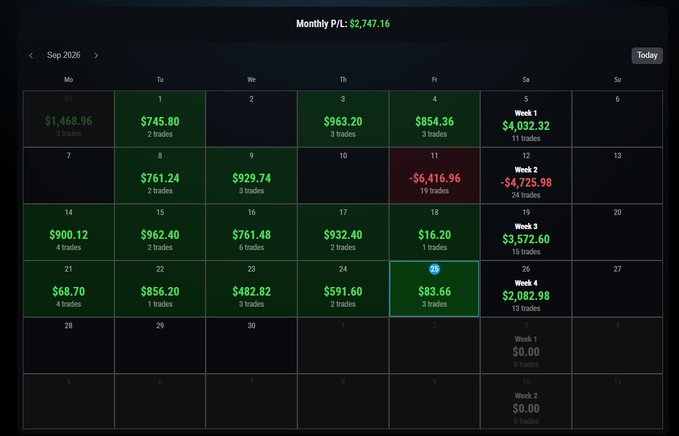
    B/E trade in Profits for $MNQ Shorts during Asia Session +$83 (1 Trade but i added to the position)

    B/E trade in Profits for $MNQ Shorts during Asia Session +$83 (1 Trade but i ad…